Applies to: R4 Version
Dashboards hold graphs and allow you to see at a glance trends and problems. All Dashboards can hold up to 9 Graphs, more than 9 will cause the additional graphs to be hidden. To add a new graph when you already have 9 graphs on your "My Dashboard" you will need to do one of 2 things:
- Delete old unused Graphs from the Dashboard
- Create a new Dashboard for displaying additional graphs
Deleting old Graphs from a Dashboard
Login to your SalesNexus Account
- Hover your mouse to the three lines at the top> Dashboards > Create/Edit Dashboards"

- Select the Dashboard you would like to delete the graph from
- Select the Graph you would like to delete

- Click the "X" to delete the selected Graph from the Dashboard

- Repeat this for any other Graphs you would like to Delete from the Dashboard
Creating a New Dashboard to hold additional Graphs
- Login to your SalesNexus Account
- Hover your mouse to the three lines at the top> Dashboards > Create/Edit Dashboards"

- Click the "+" to add a new Dashboard

- Give your new Dashboard a name

- Click Create
Pushing your Dashboard to Another User
- Hover your mouse to the three lines at the top> Dashboards > Create/Edit Dashboards"

- Select the Dashboard you want to "Push"
- Select a Graph
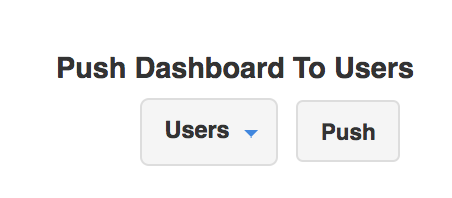
- On the Far right side of the screen you will see "Push Dashboard To Users"

- Select the User(s) from the "Users" list
- Click "Push"
- The other users can now see your Dashboard in their X > Dashboards list

Comments
0 comments
Please sign in to leave a comment.